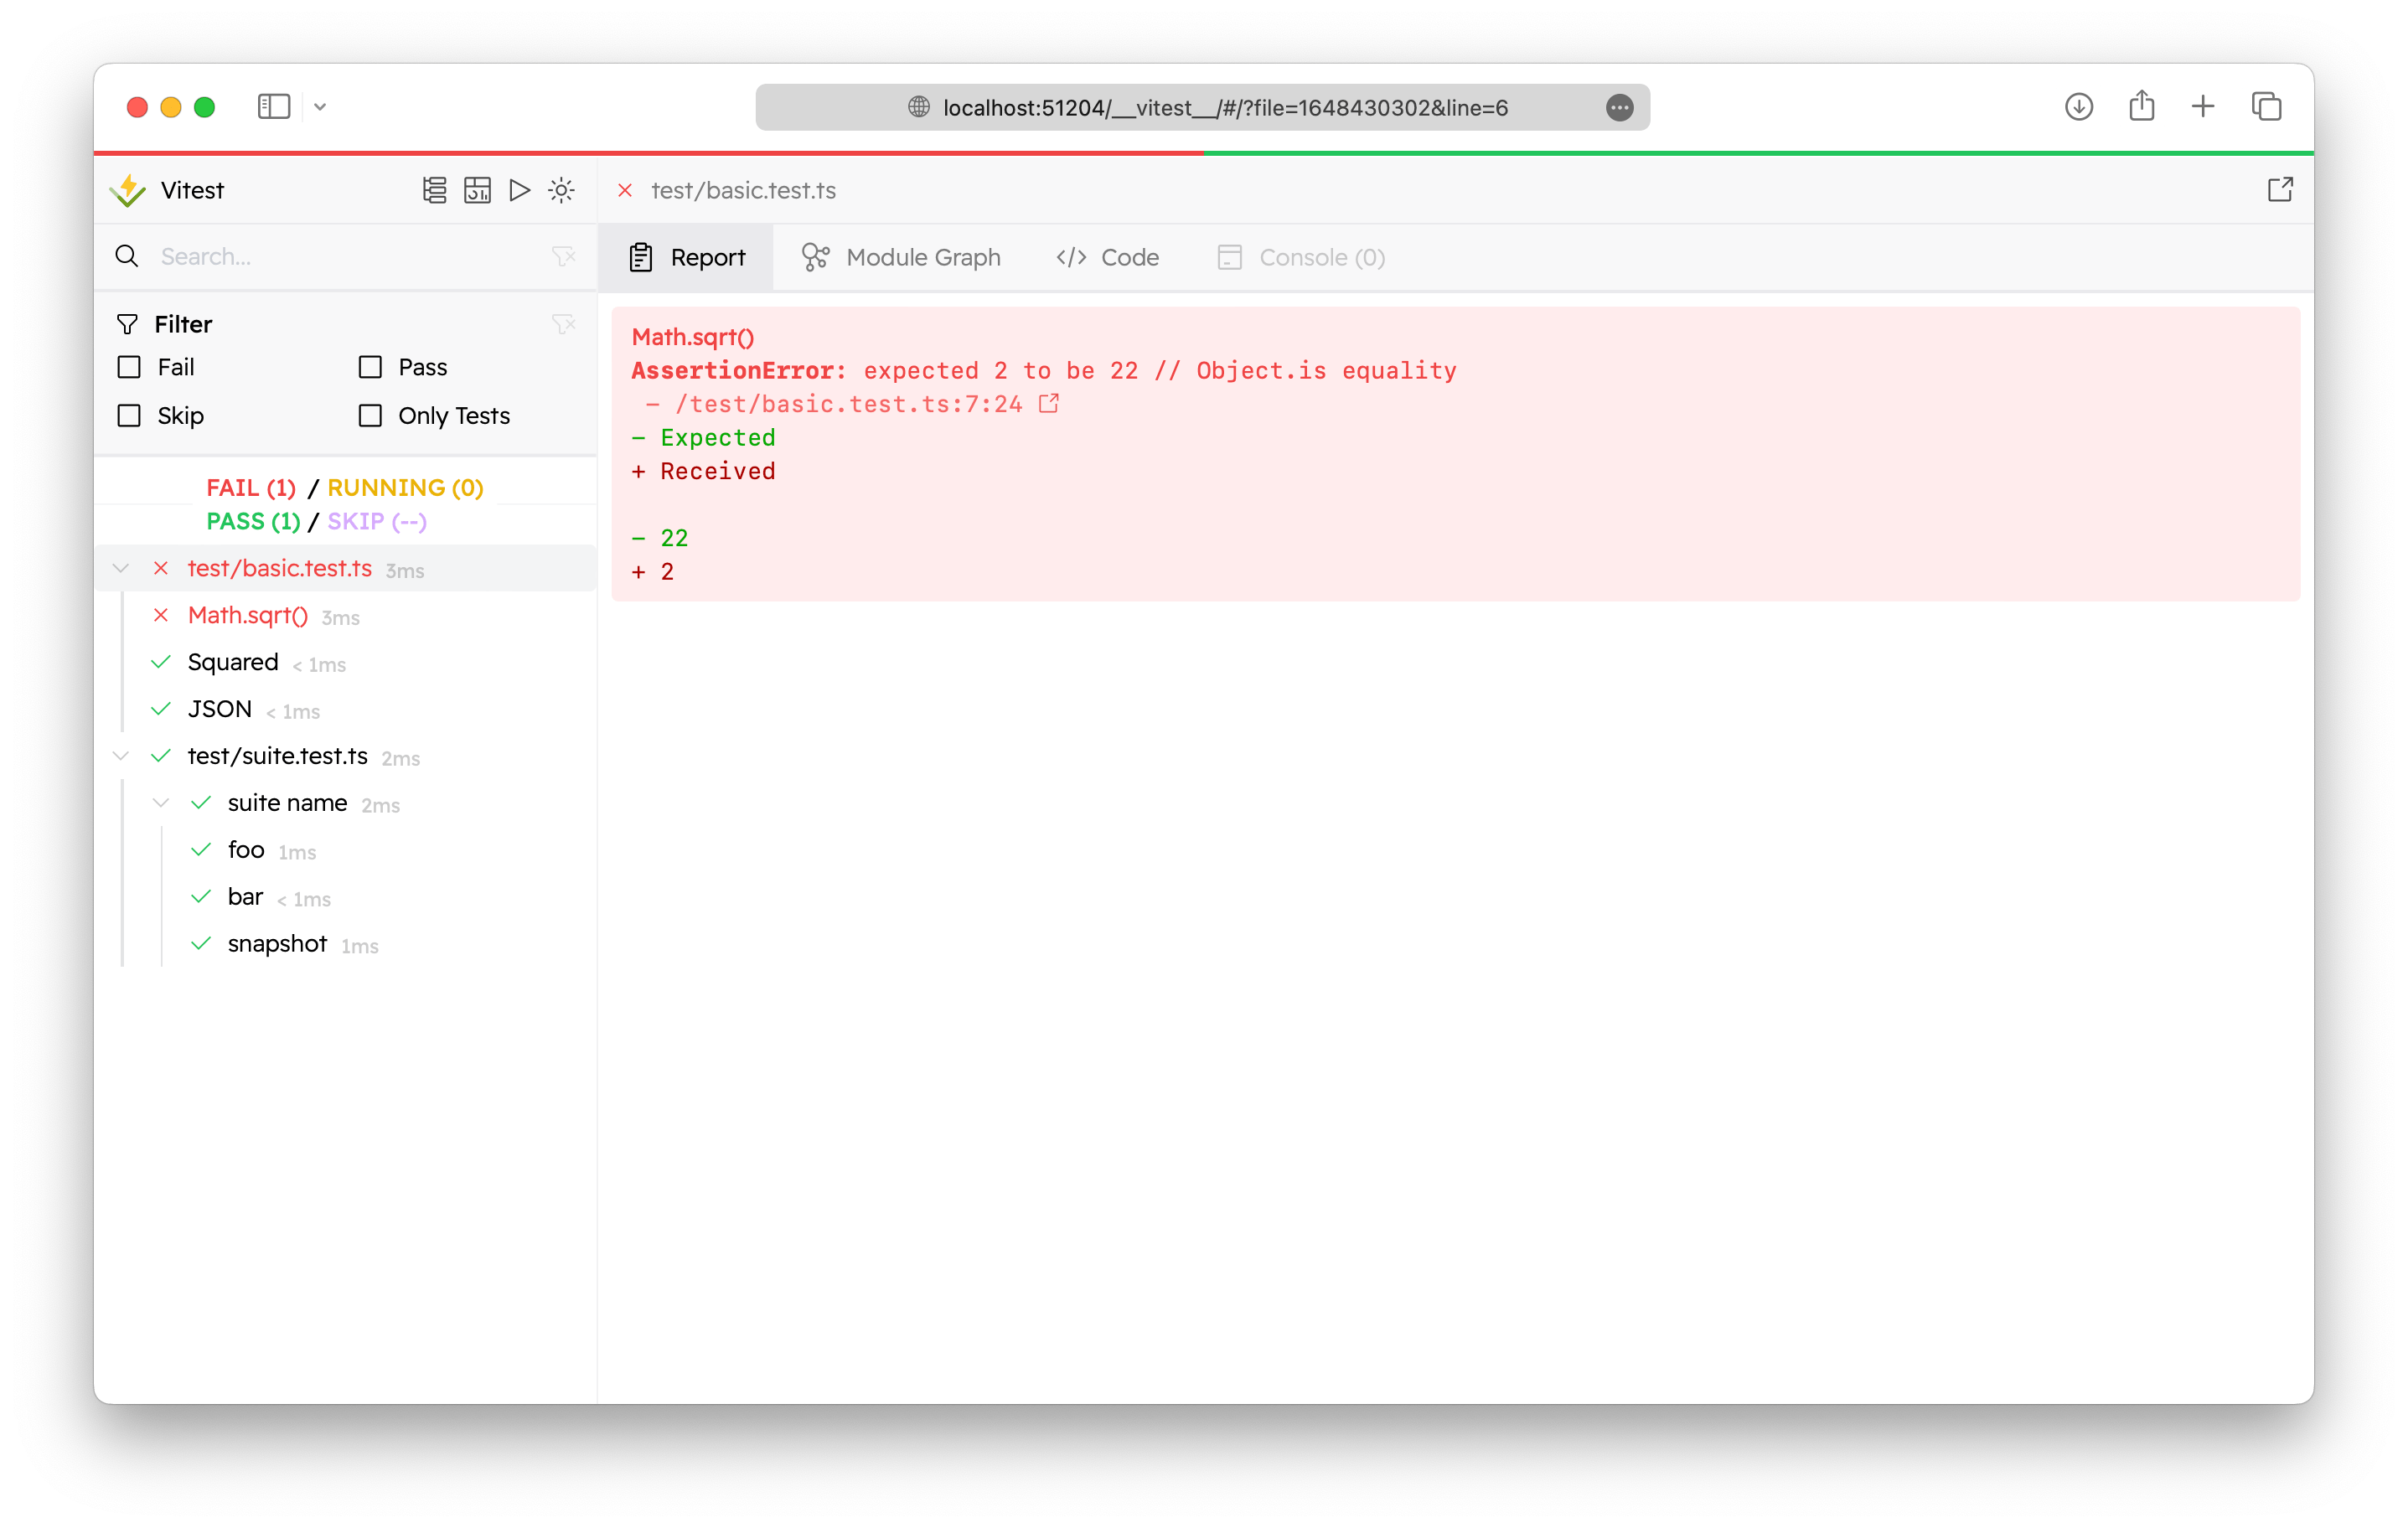
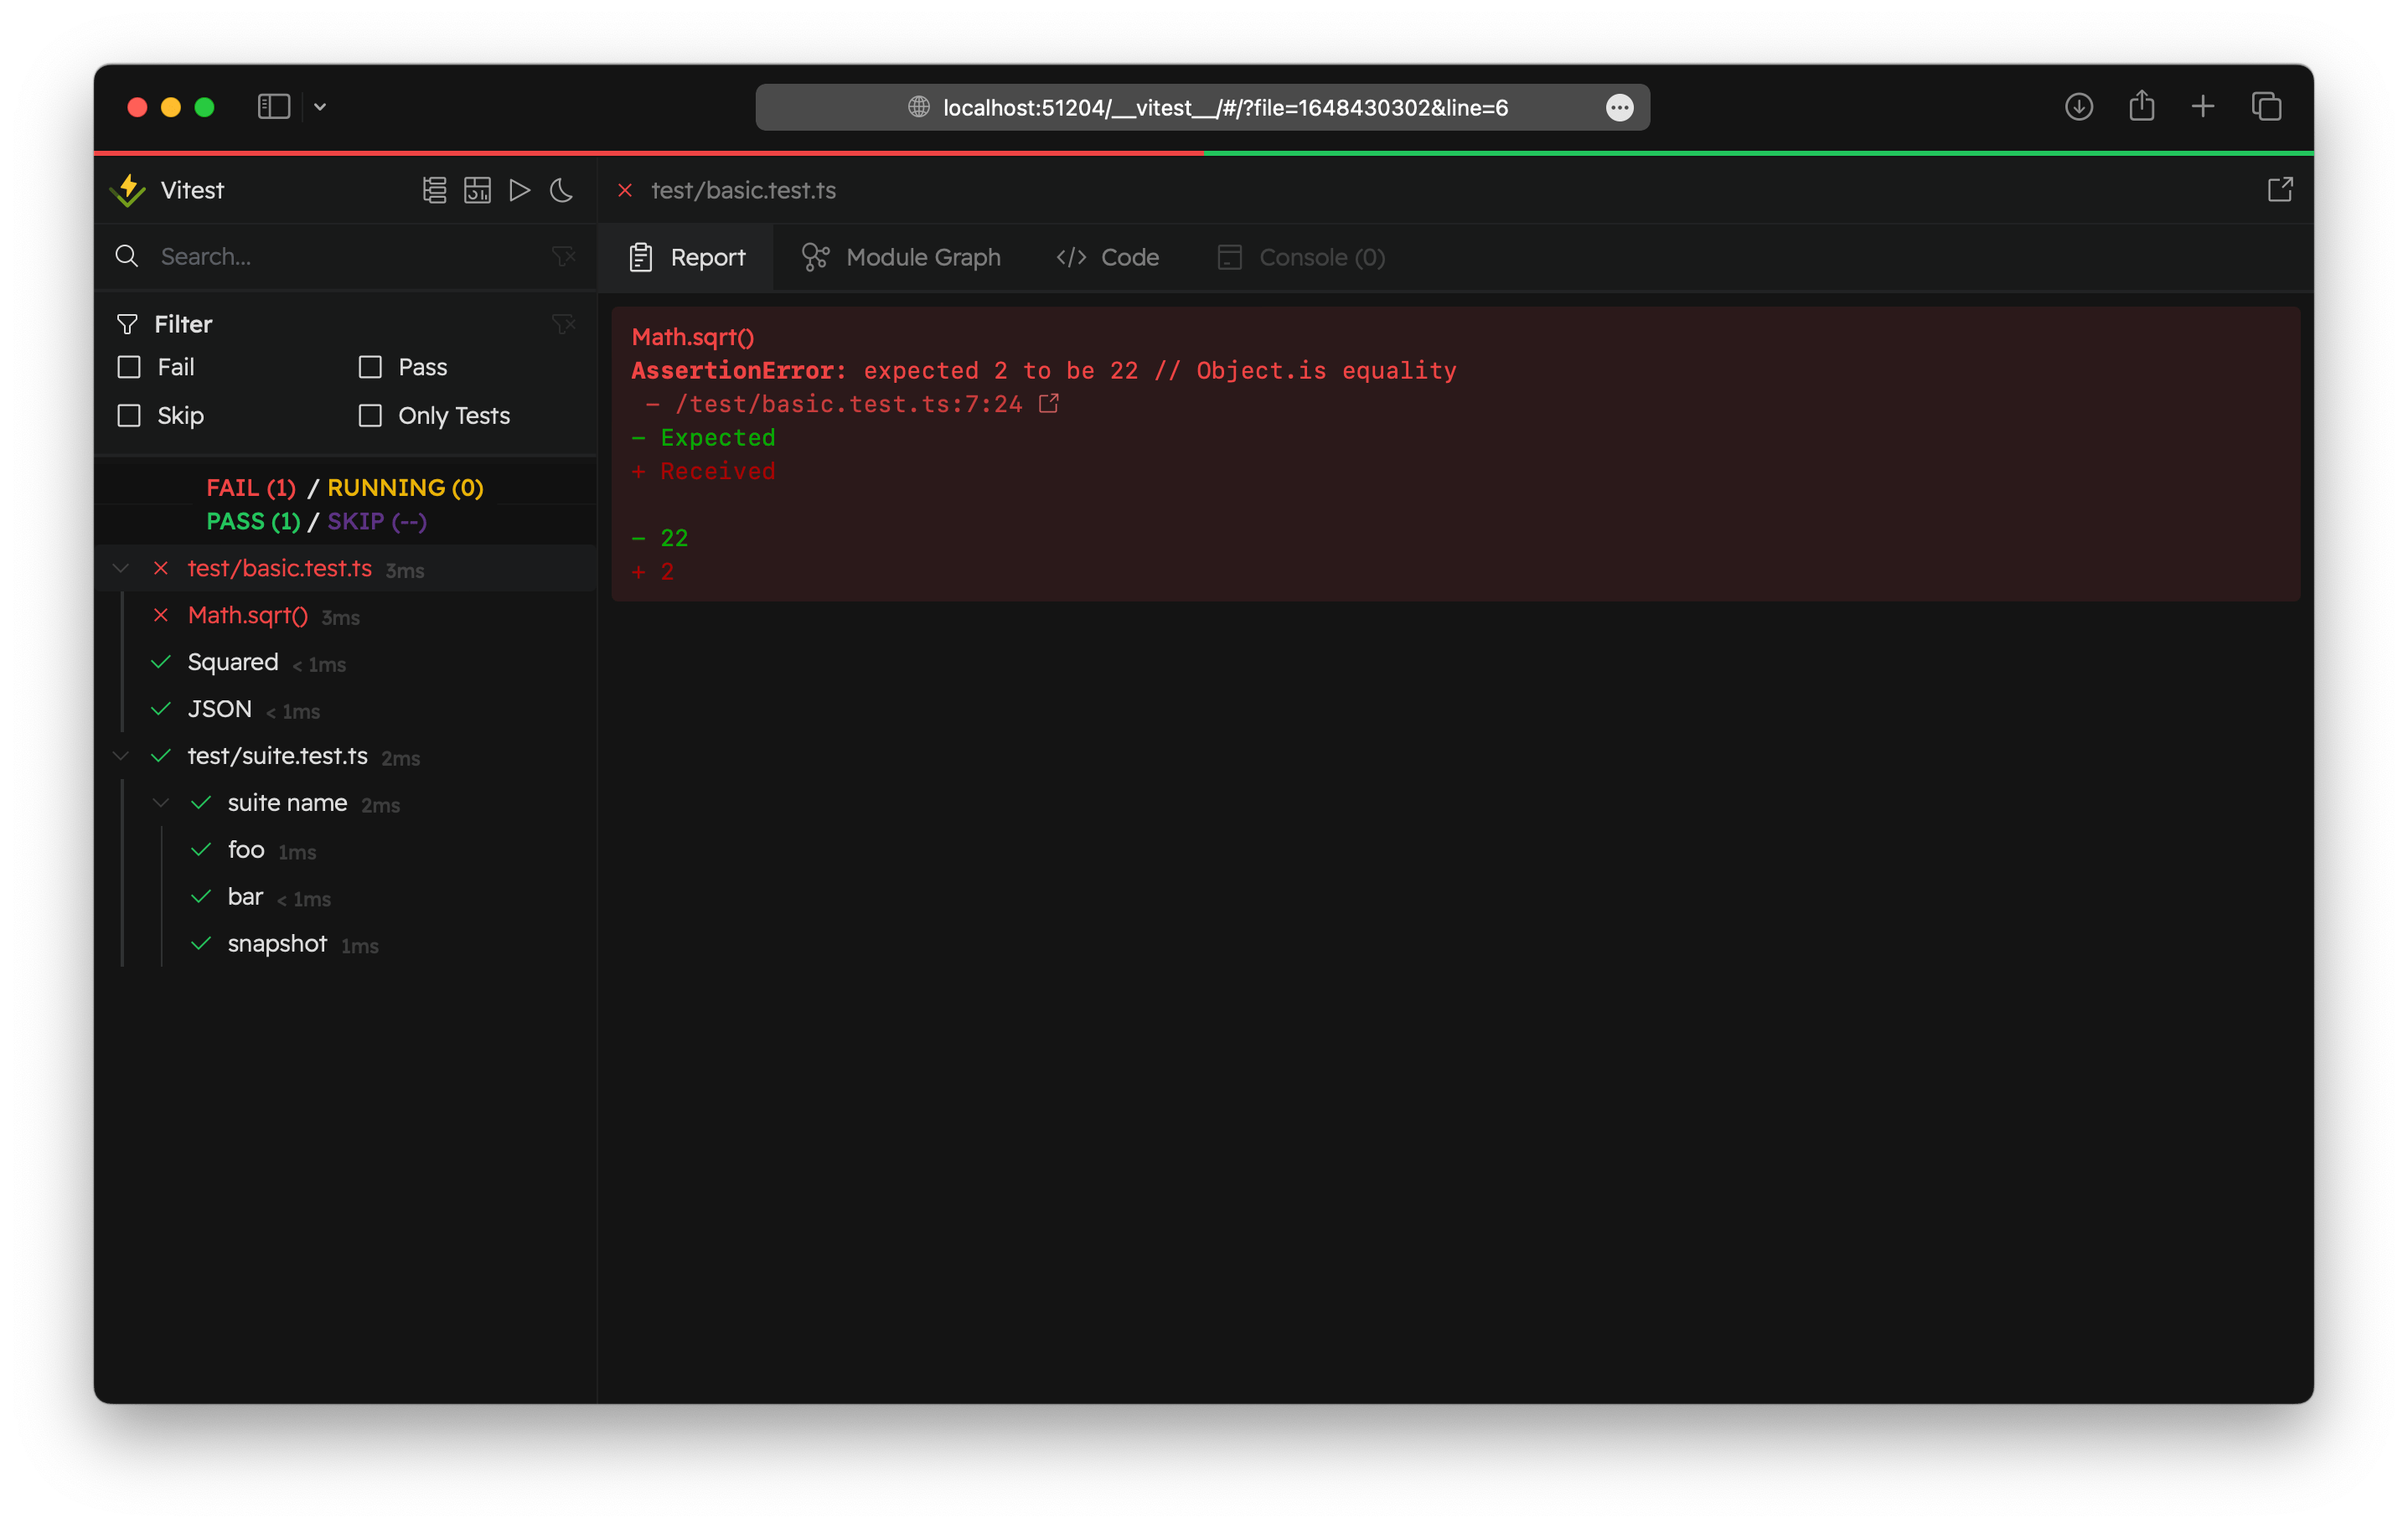
Vitest UI
Powered by Vite, Vitest also has a dev server under the hood when running the tests. This allows Vitest to provide a beautiful UI to view and interact with your tests. The Vitest UI is optional, so you'll need to install it with:
npm i -D @vitest/uiThen you can start the tests with UI by passing the --ui flag:
vitest --uiThen you can visit the Vitest UI at http://localhost:51204/__vitest__/
WARNING
The UI is interactive and requires a running Vite server, so make sure to run Vitest in watch mode (the default). Alternatively, you can generate a static HTML report that looks identical to the Vitest UI by specifying html in config's reporters option.
UI can also be used as a reporter. Use 'html' reporter in your Vitest configuration to generate HTML output and preview the results of your tests:
import { defineConfig } from 'vitest/config'

export default defineConfig({
  test: {
    reporters: ['html'],
  },
})
You can check your coverage report in Vitest UI: see Vitest UI Coverage for more details.
WARNING
If you still want to see how your tests are running in real time in the terminal, don't forget to add default reporter to reporters option: ['default', 'html'].
TIP
To preview your HTML report, you can use the vite preview command:
npx vite preview --outDir ./htmlYou can configure output with outputFile config option. You need to specify .html path there. For example, ./html/index.html is the default value.
Module Graph
Module Graph's tab displays the module graph of the selected test file.
INFO
All of the provided images use Zammad repository as an example.
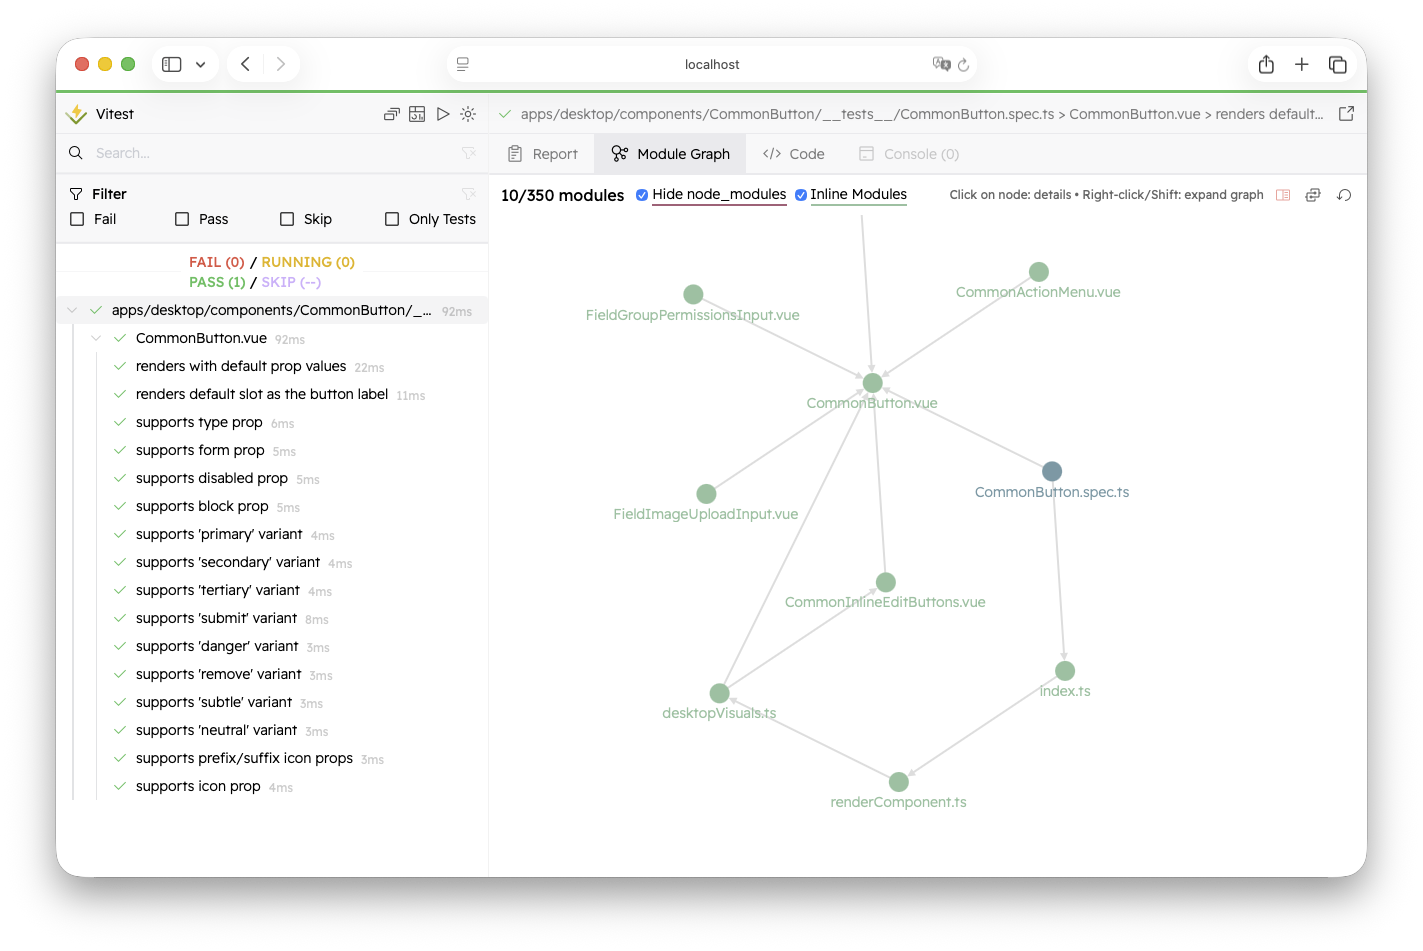
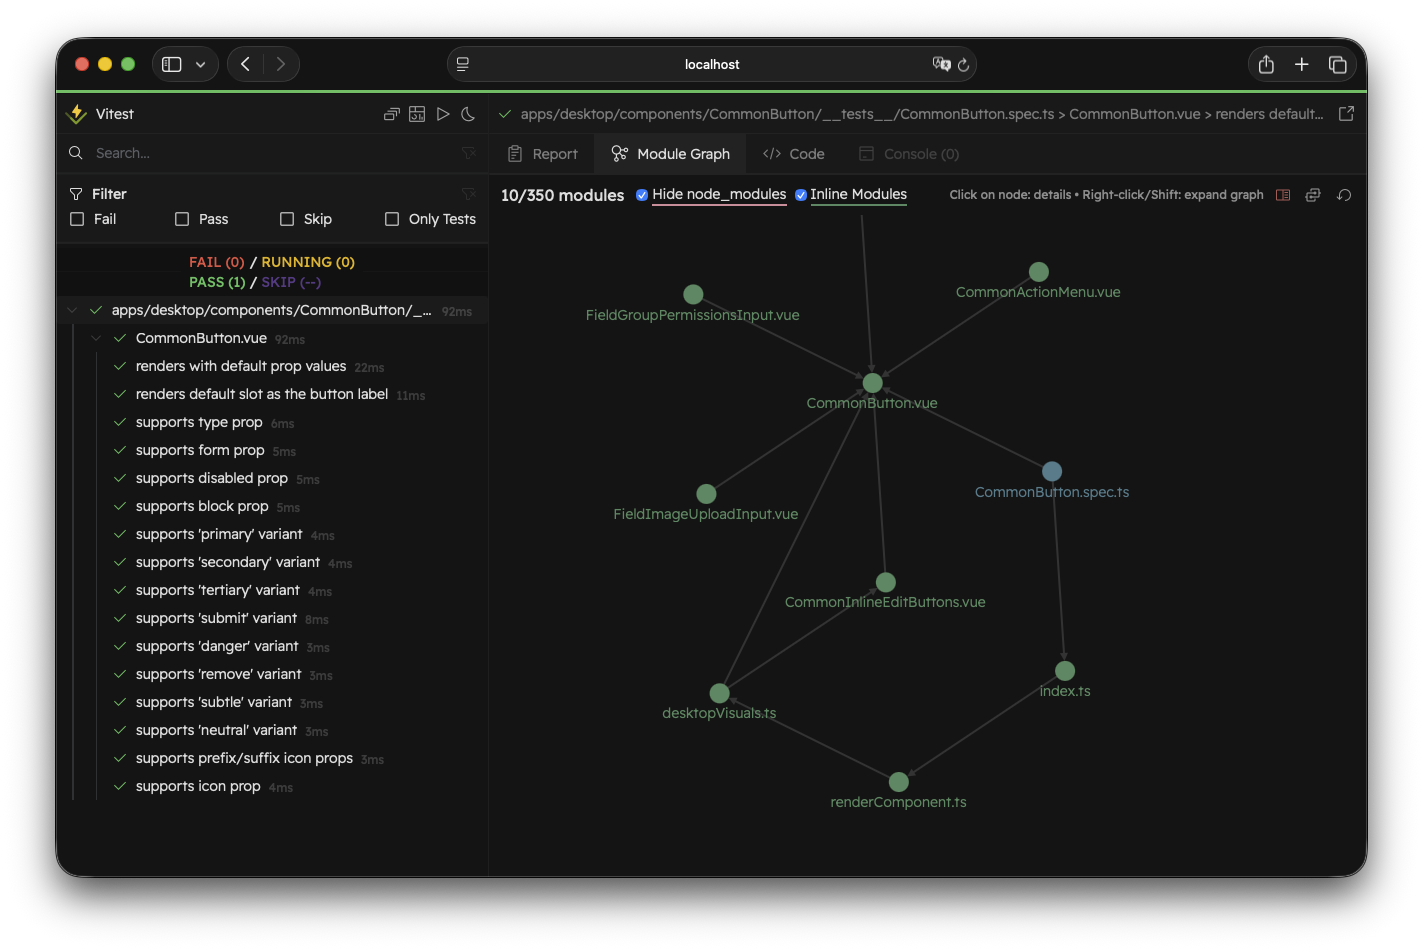
If there are more than 50 modules, the module graph displays only the first two levels of the graph to reduce the visual clutter. You can always click on "Show Full Graph" icon to preview the full graph.
WARNING
Note that if your graph is too big, it may take some time before the node positions are stabilized.
You can always restore the entry module graph by clicking on "Reset". To expand the module graph, right-click or hold Shift while clicking the node that interests you. It will display all nodes related to the selected one.
By default, Vitest doesn't show the modules from node_modules. Usually, these modules are externalized. You can enable them by deselecting "Hide node_modules".
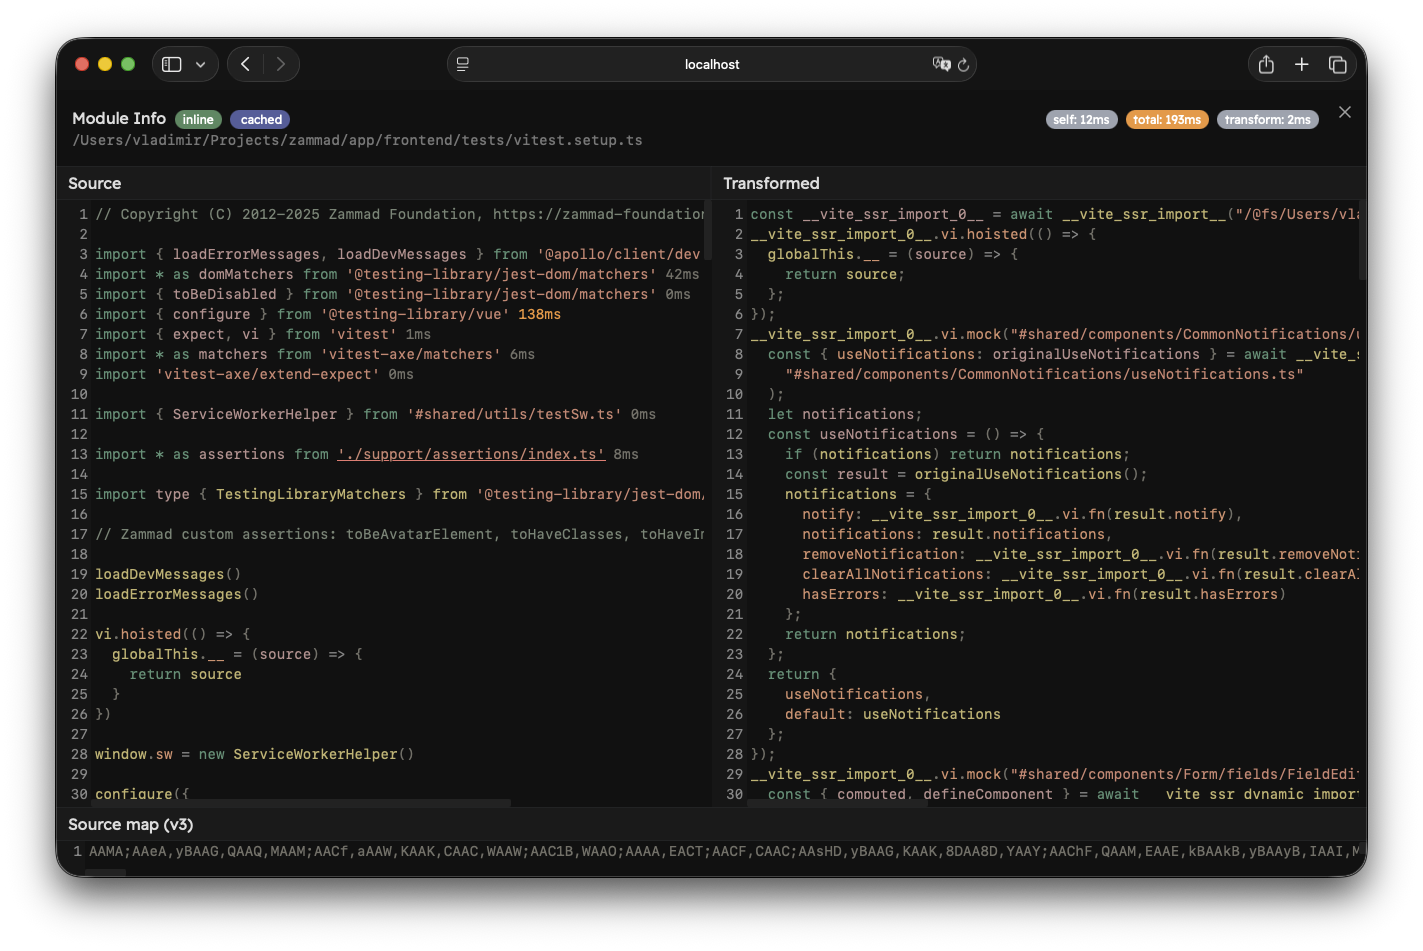
Module Info
By left-clicking on the module node, you open the Module Info view.

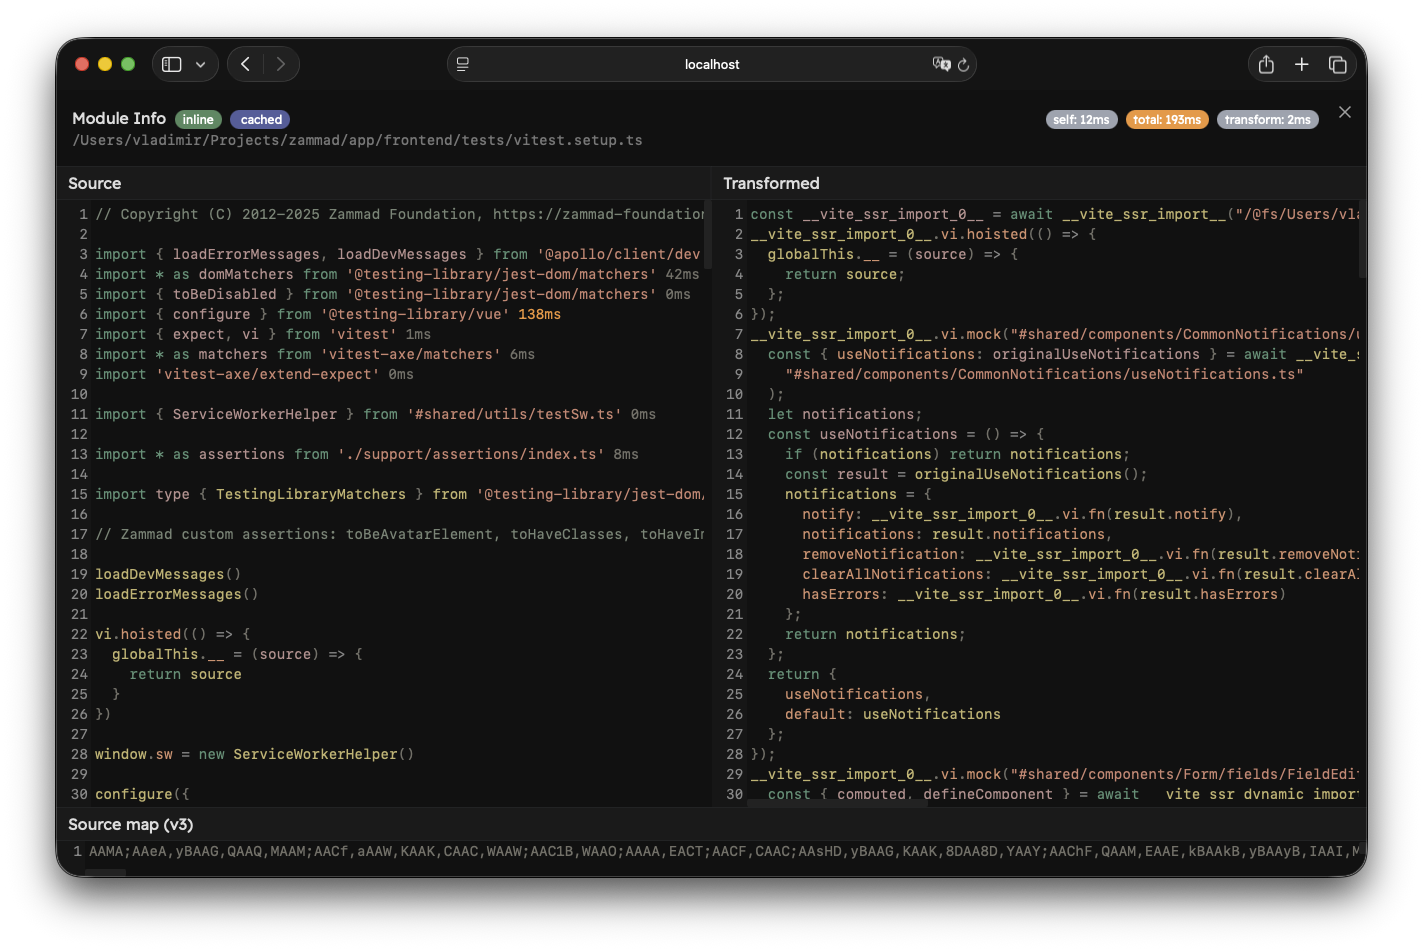
This view is separated into two parts. The top part shows the full module ID and some diagnostics about the module. If experimental.fsModuleCache is enabled, there will be a "cached" or "not cached" badge. On the right you can see time diagnostics:
- Self Time: the time it took to import the module, excluding static imports.
- Total Time: the time it took to import the module, including static imports. Note that this does not include
transformtime of the current module. - Transform: the time it took to transform the module.
If you opened this view by clicking on an import, you will also see a "Back" button at the start that will take you to the previous module.
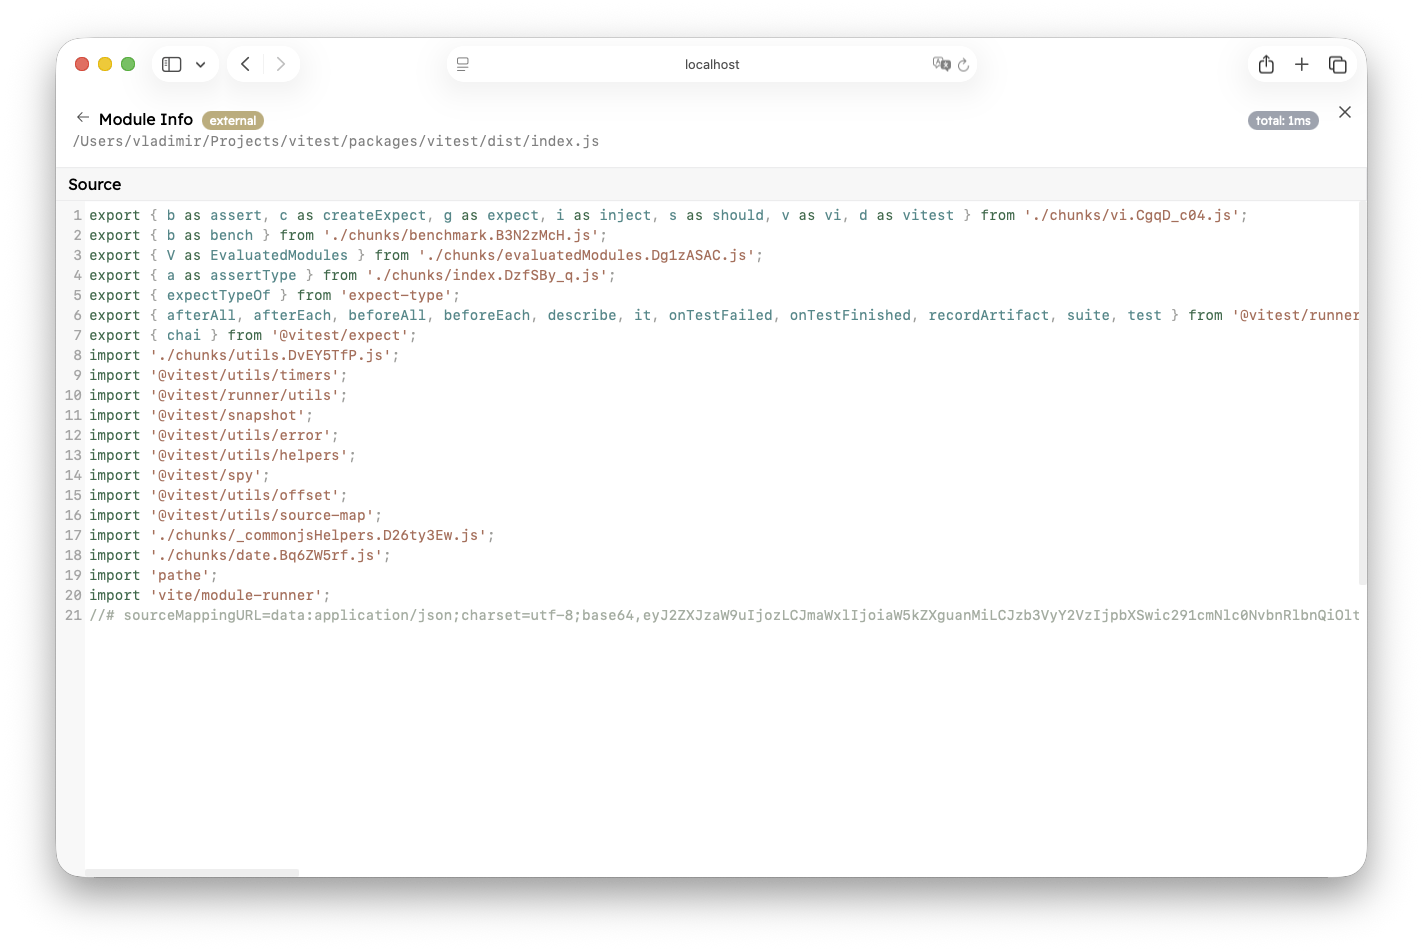
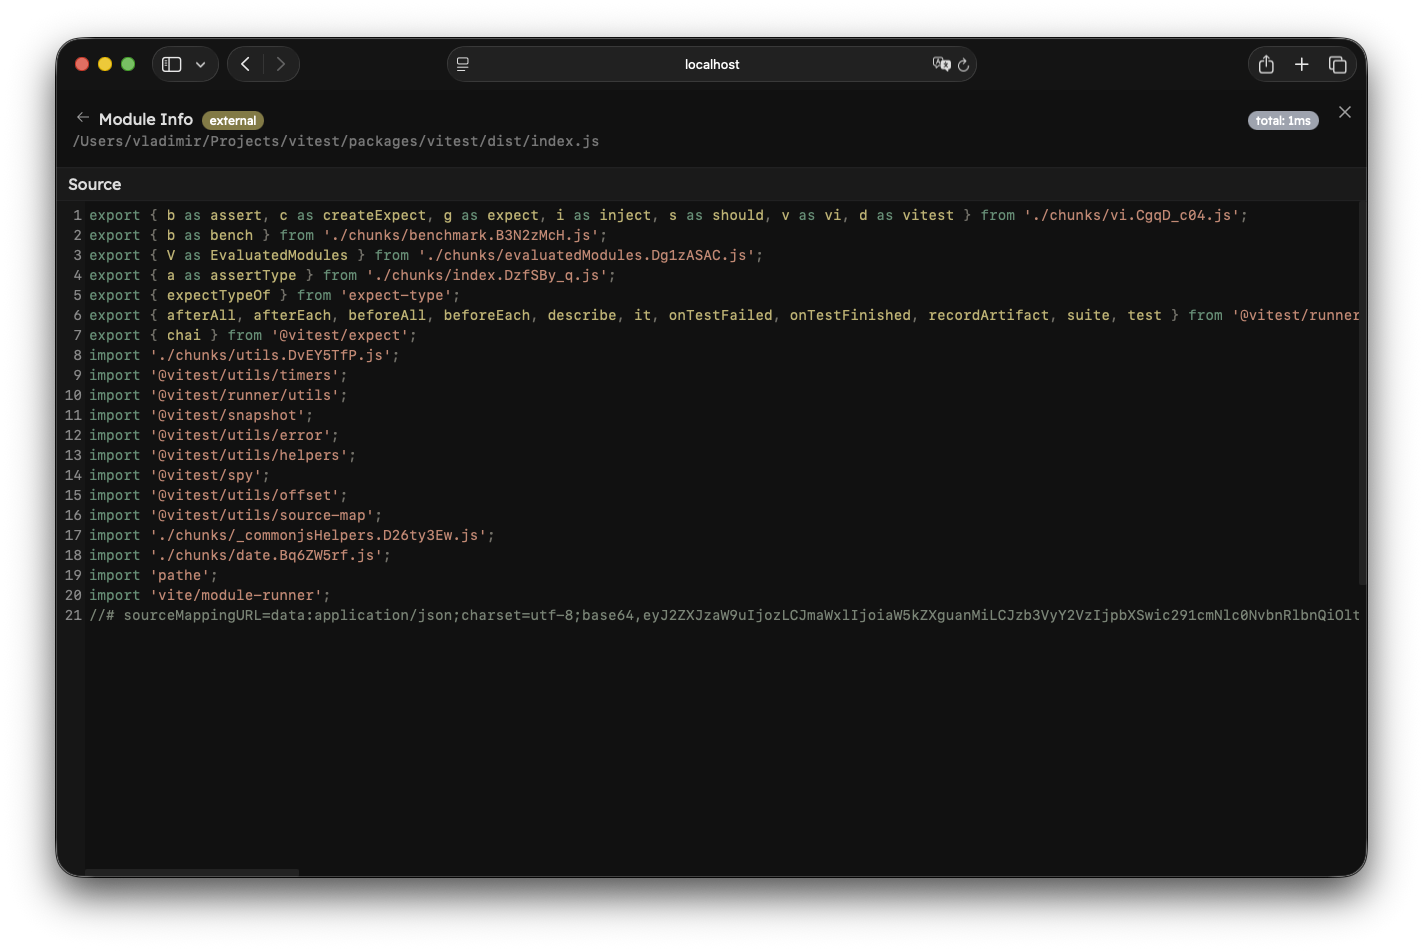
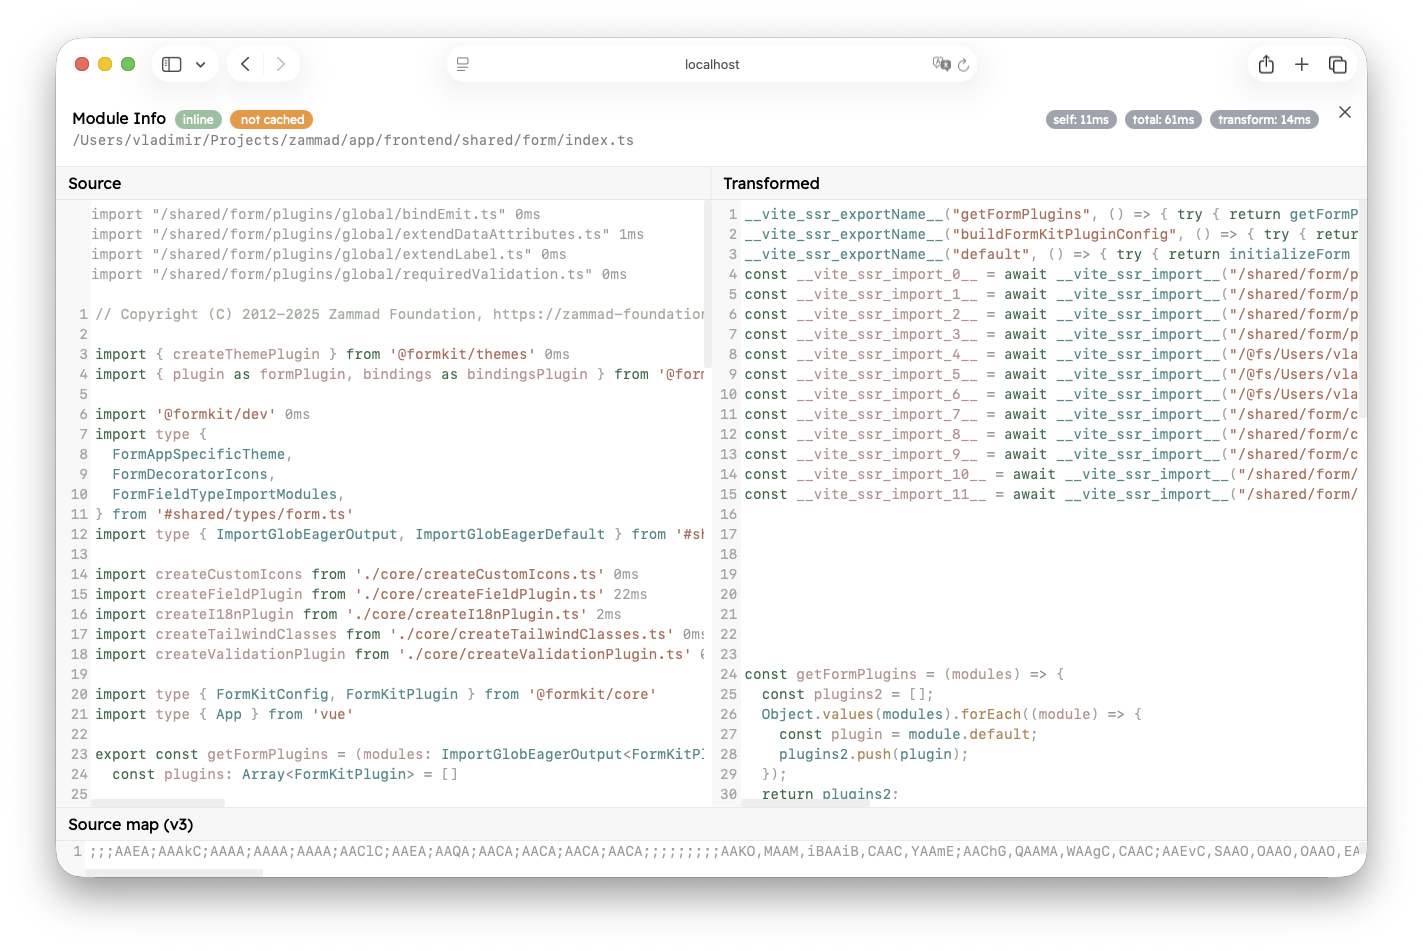
The bottom part depends on the module type. If the module is external, you will only see the source code of that file. You will not be able to traverse the module graph any further, and you won't see how long it took to import static imports.
If the module was inlined, you will see three more windows:
- Source: unchanged source code of the module
- Transformed: the transformed code that Vitest executes using Vite's module runner
- Source Map (v3): source map mappings
All static imports in the "Source" window show a total time it took to evaluate them by the current module. If the import was already evaluated in the module graph, it will show 0ms because it is cached by that point.
If the module took longer than 500 milliseconds to load, the time will be displayed in red. If the module took longer than 100 milliseconds, the time will be displayed in orange.
You can click on an import source to jump into that module and traverse the graph further (note ./support/assertions/index.ts below).
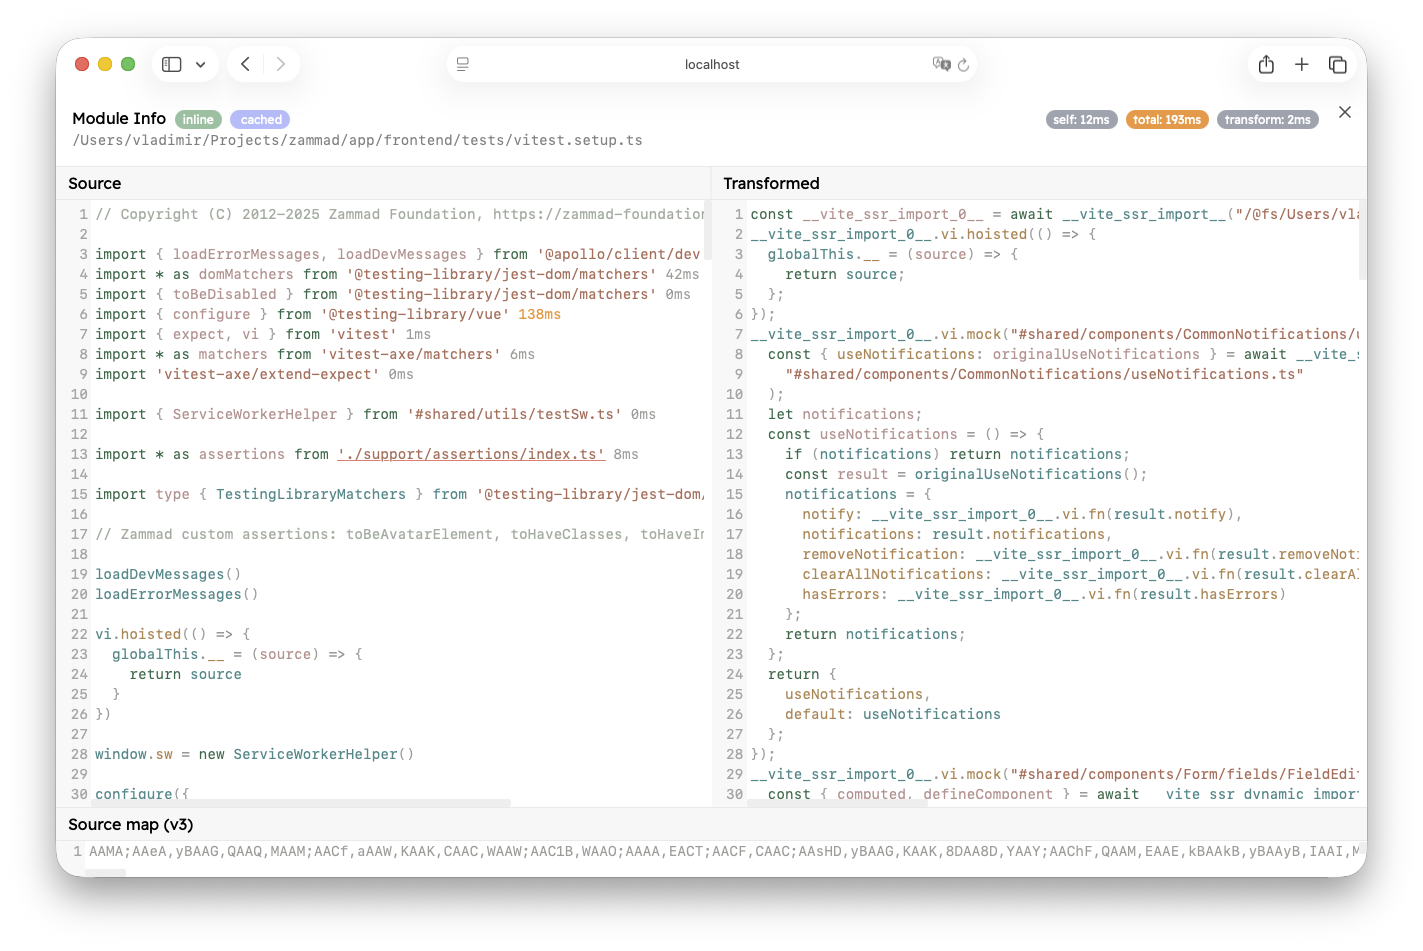
WARNING
Note that type-only imports are not executed at runtime and do not display a total duration. They also cannot be opened.
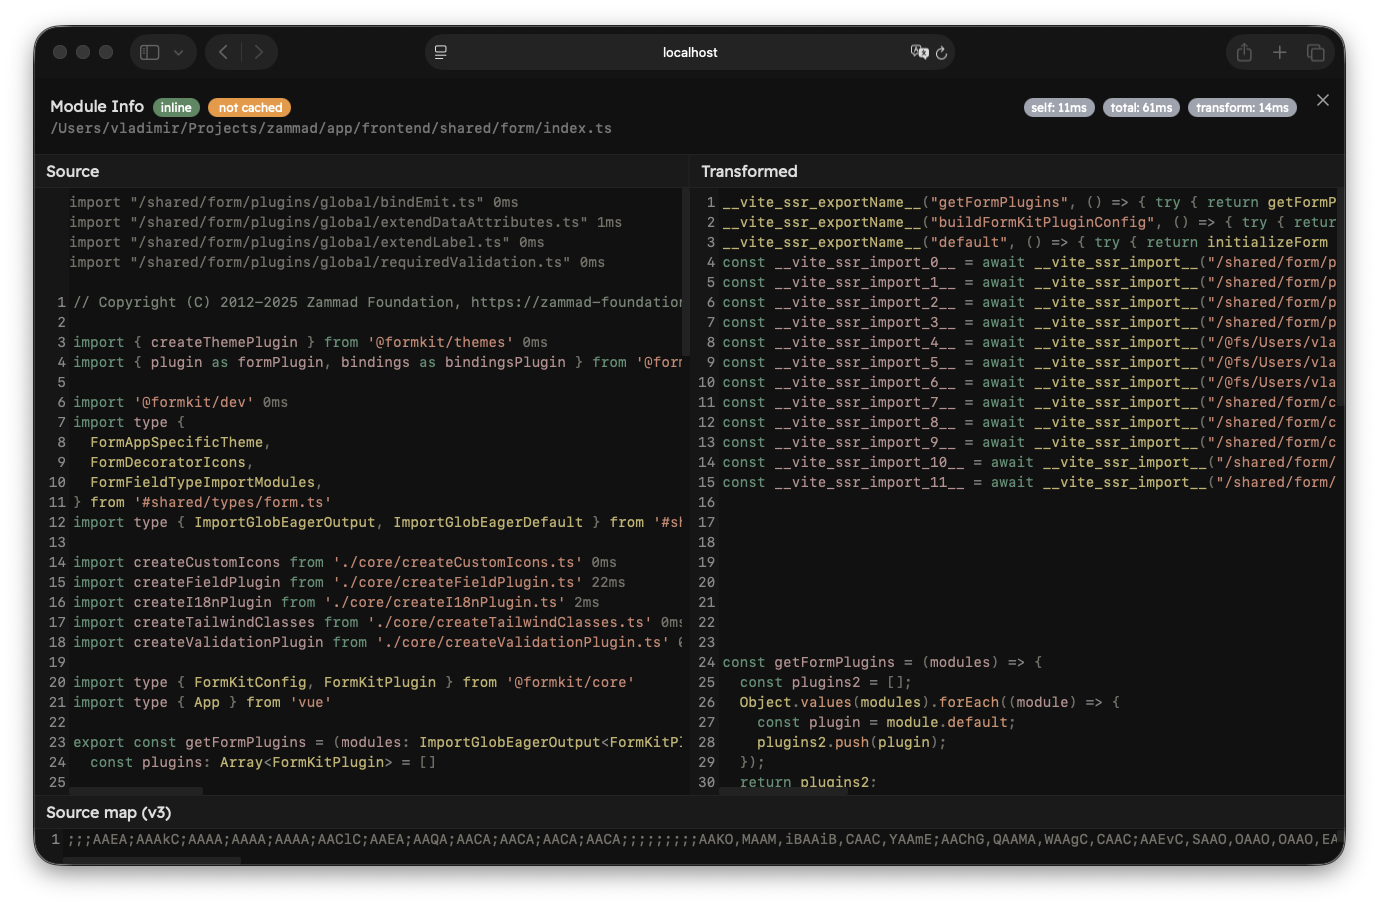
If another plugin injects a module import during transformation, those imports will be displayed at the start of the module in gray colour (for example, modules injected by import.meta.glob). They also show the total time and can be traversed further.
TIP
If you are developing a custom integration on top of Vitest, you can use vitest.experimental_getSourceModuleDiagnostic to retrieve this information.
Import Breakdown
The Module Graph tab also provides an Import Breakdown with a list of modules that take the longest time to load (top 10 by default, but you can press "Show more" to load 10 more), sorted by Total Time.
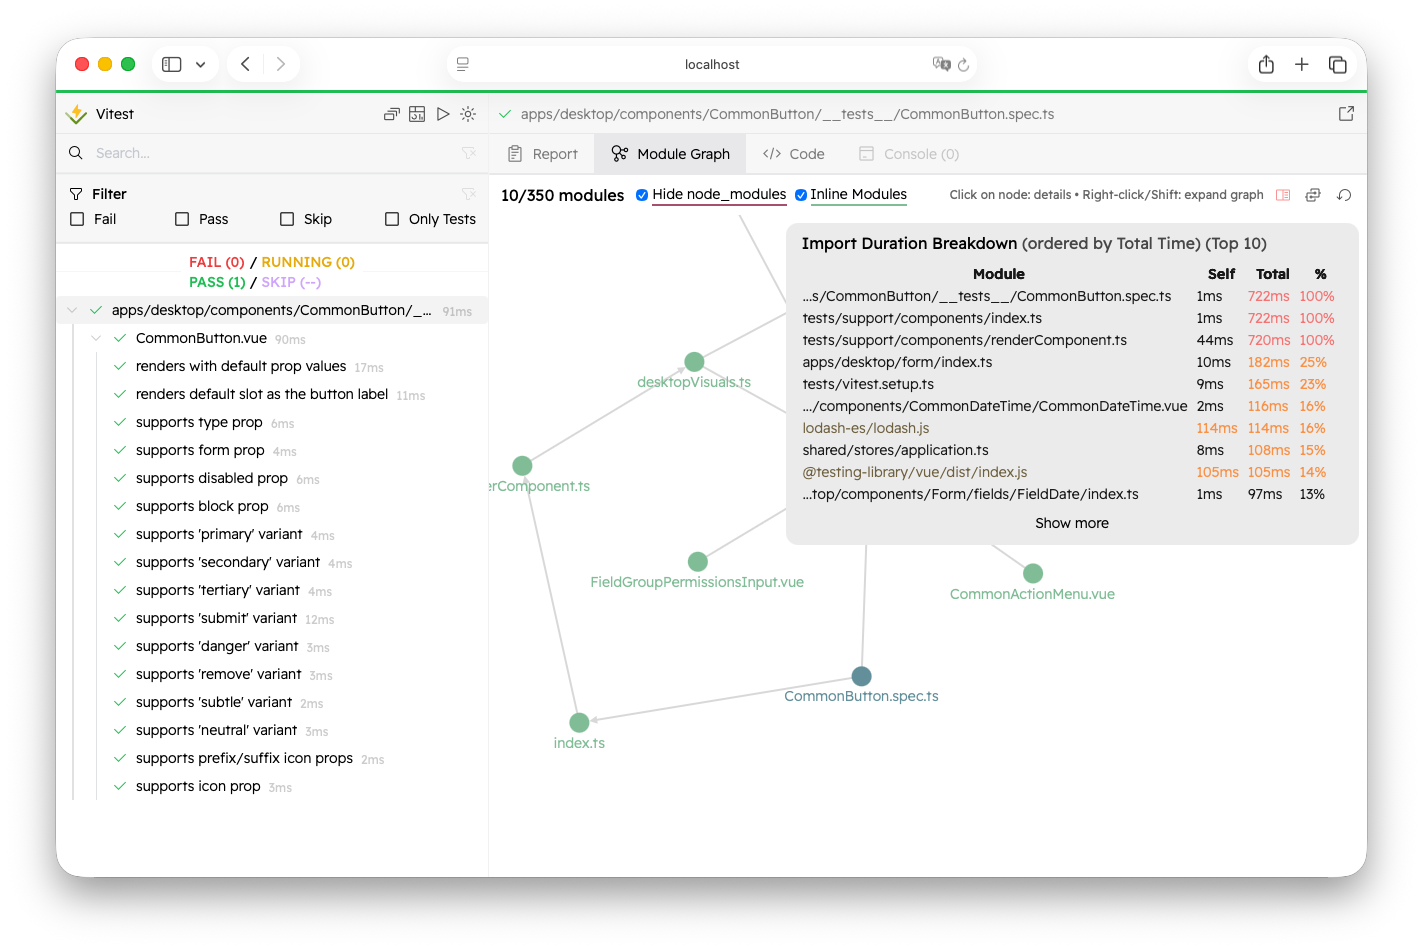
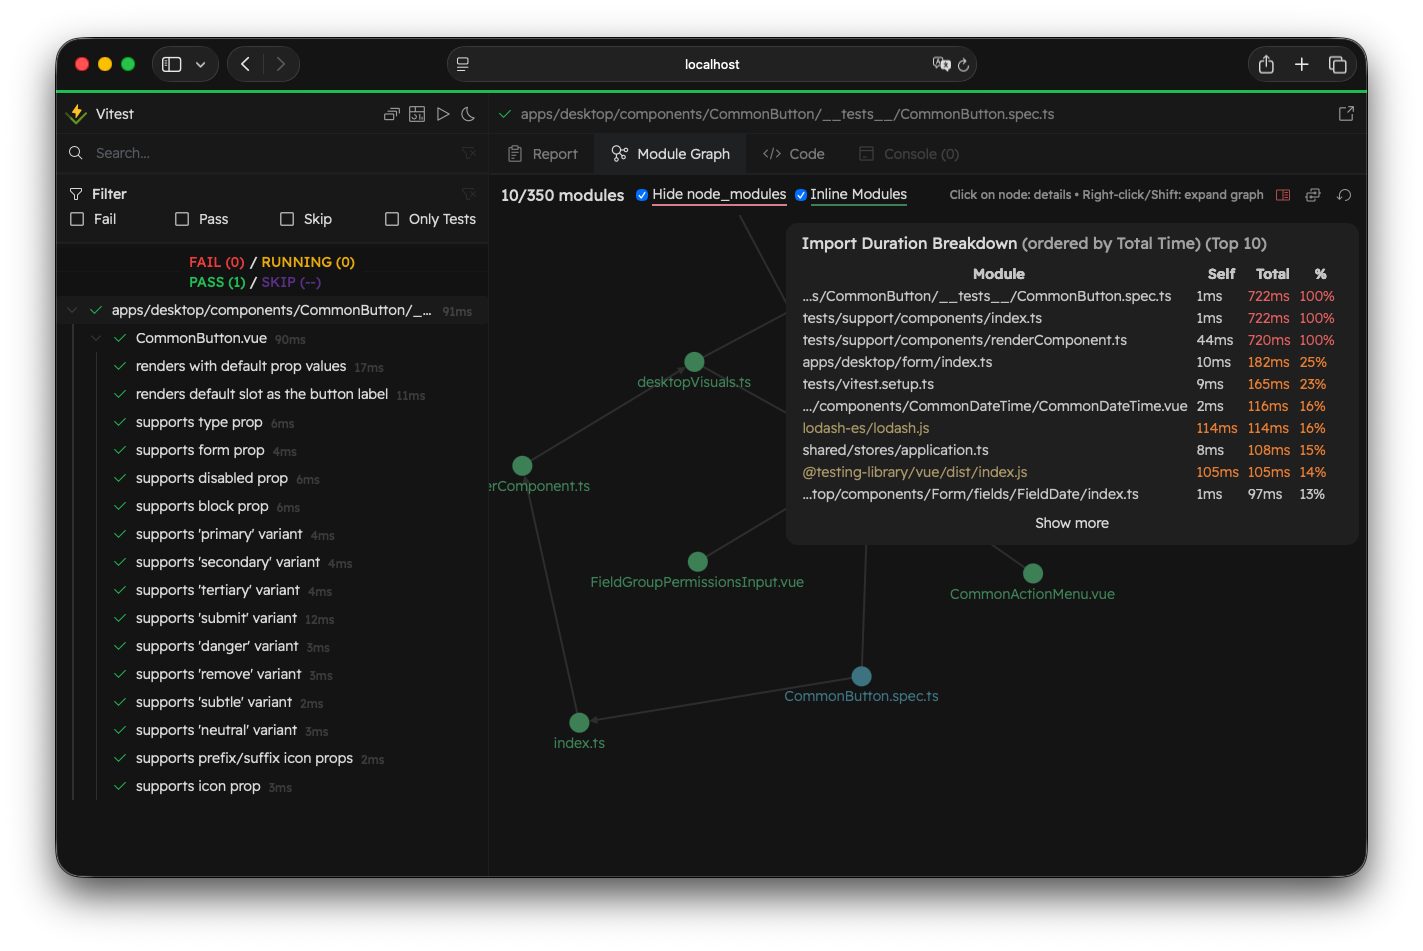
You can click on the module to see the Module Info. If the module is external, it will have the yellow color (the same color in the module graph).
The breakdown shows a list of modules with self time, total time, and a percentage relative to the time it took to load the whole test file.
The "Show Import Breakdown" icon will have a red color if there is at least one file that took longer than 500 milliseconds to load, and it will be orange if there is at least one file that took longer than 100 milliseconds.
By default, Vitest shows the breakdown automatically if there is at least one module that took longer than 500 milliseconds to load. You can control the behaviour by setting the experimental.printImportBreakdown option.